
Booth-level voter analysis for Indian elections
We combine past results, electoral roll data, demographics and fresh survey findings into a booth-by-booth picture of a constituency, so that a campaign knows where support is strong, where it is soft and where effort will make the biggest difference.
Every booth classified and prioritised
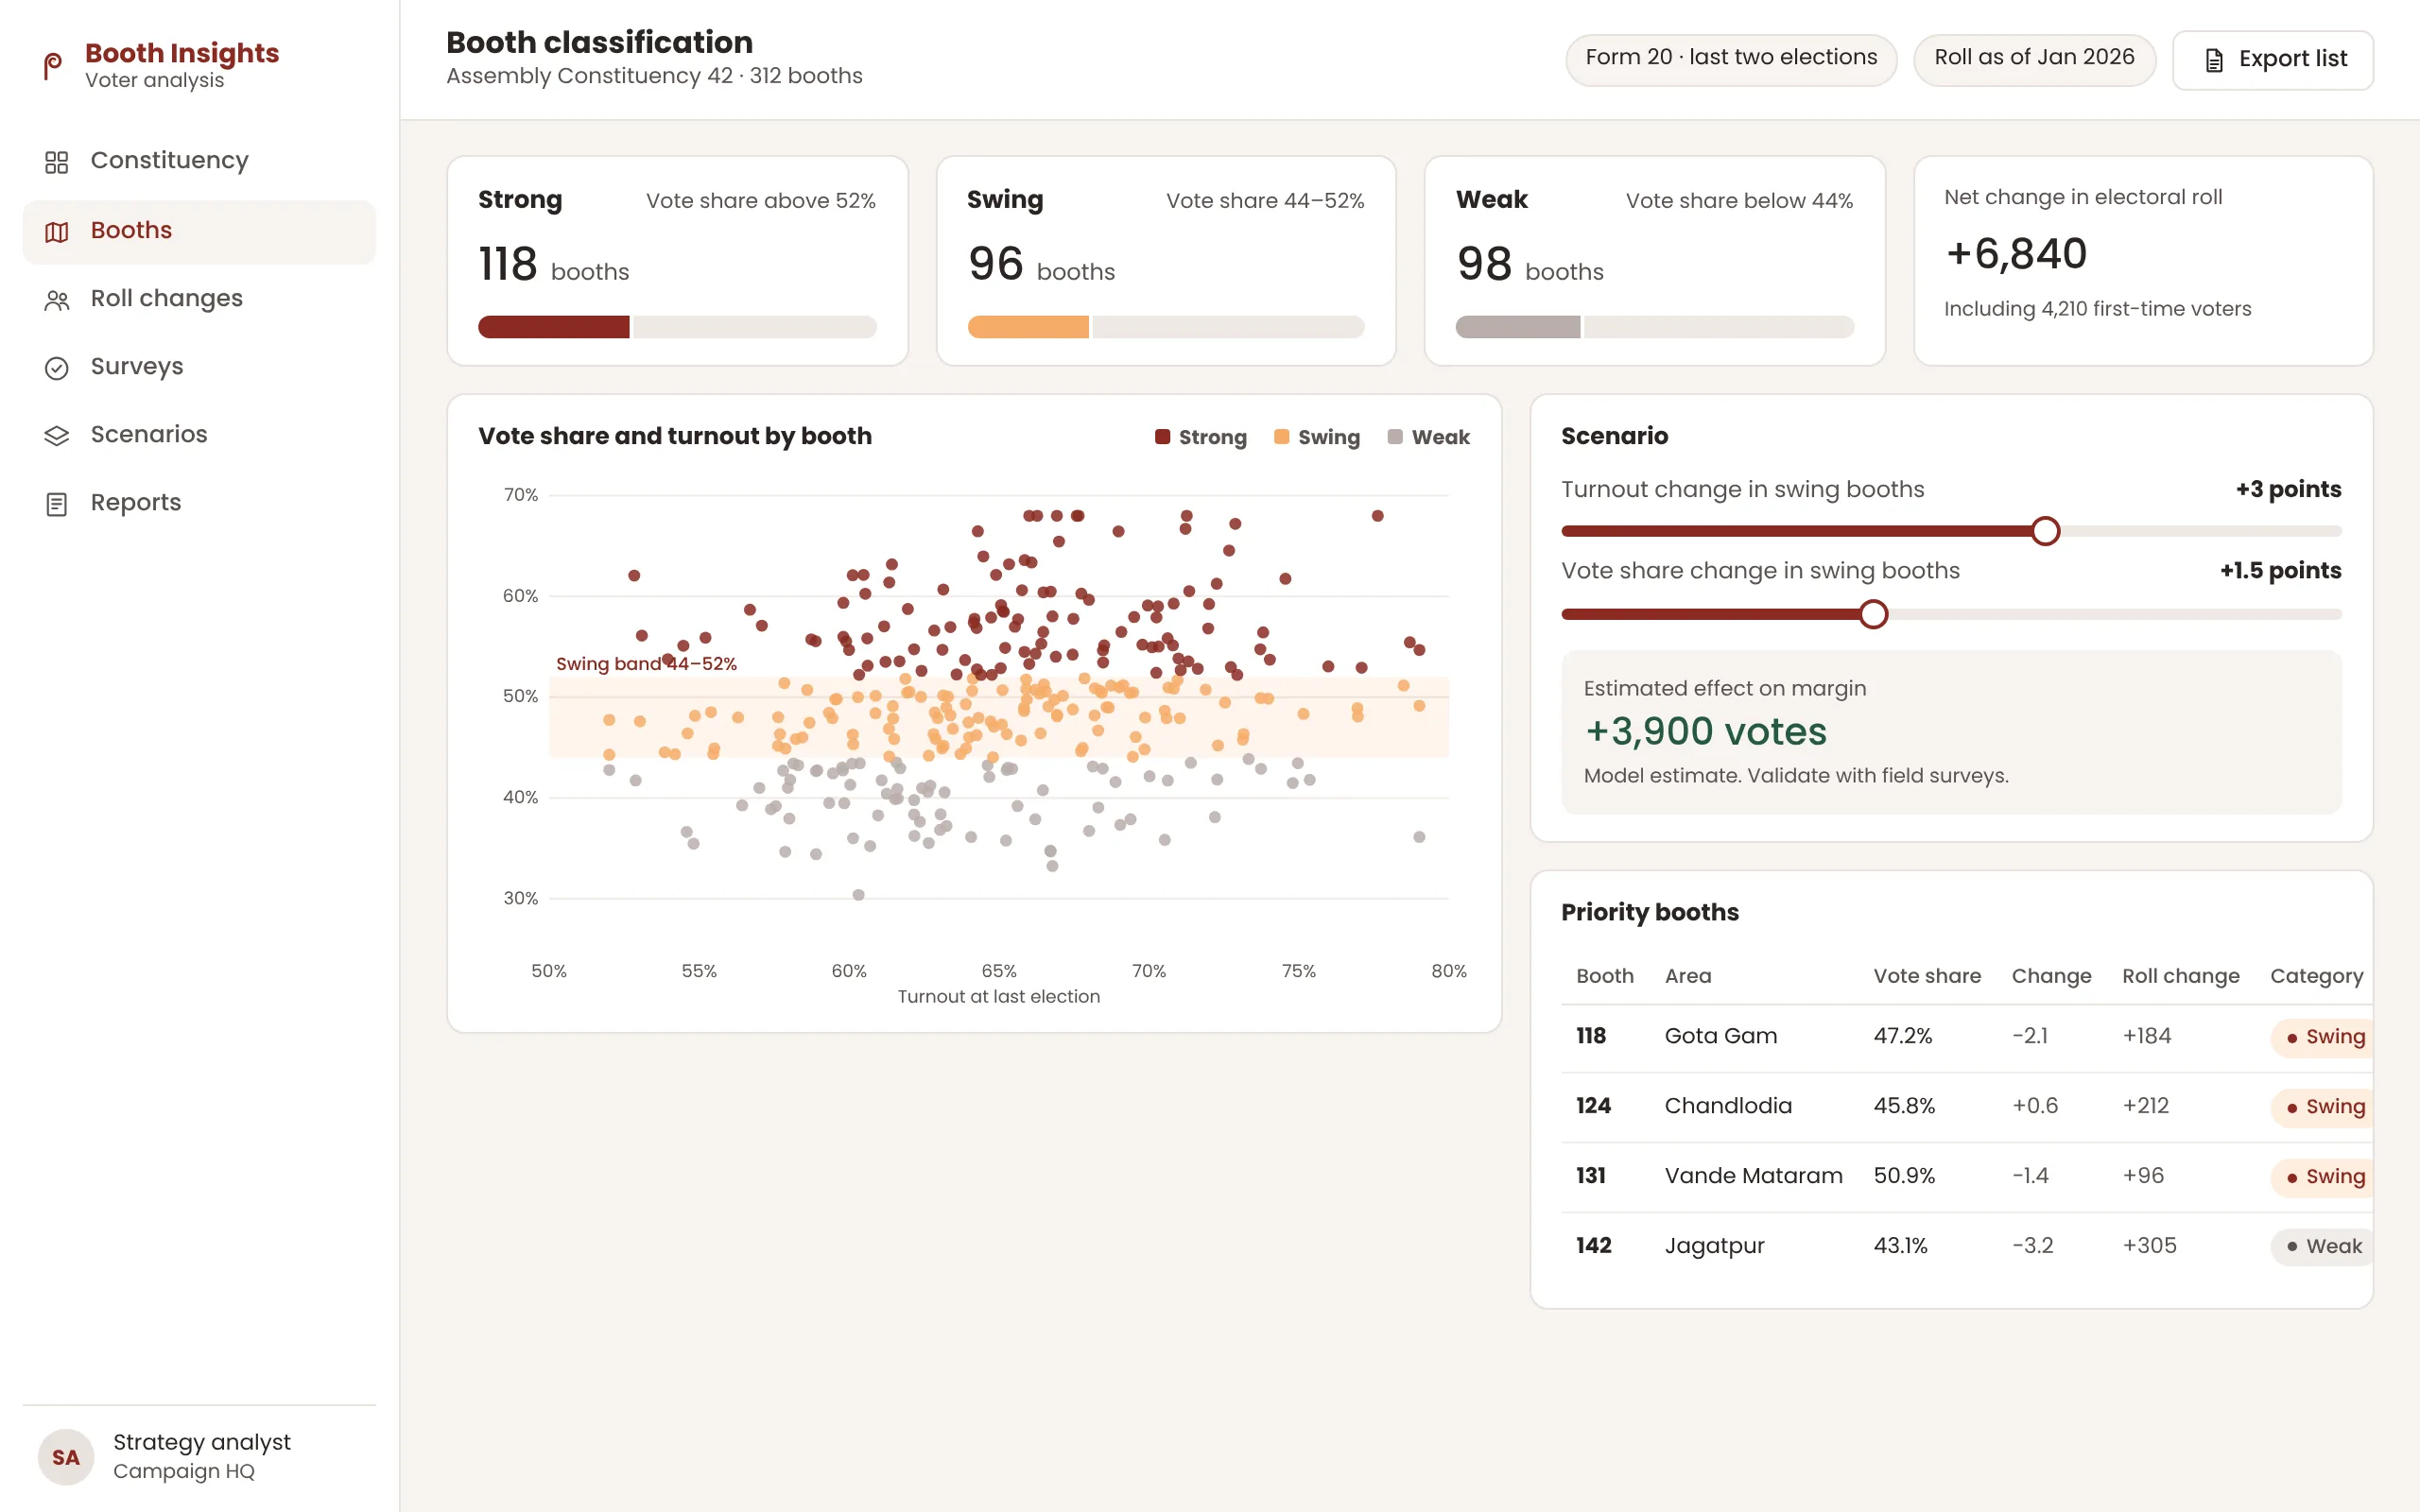
Elections are won booth by booth
Polling station results published in Form 20 show how each booth voted in past elections, and electoral rolls show how the voter base has changed since. Read together with survey data, they reveal which booths are dependable, which are swinging and which have room to grow.
Our voter analysis turns these sources into maps, tables and short recommendations that a campaign team can act on. We classify booths, track additions and deletions in the rolls, measure shifts between elections and connect the findings to field work, so that worker time, outreach and events go where they count.
What our voter analysis includes
Past result analysis
Booth-wise results from Form 20 across several elections, with vote share trends and margins.
Booth classification
Booths grouped as strong, weak or swing, using clear criteria your team can review.
Electoral roll trends
Additions, deletions, first-time voters and age profile changes by booth and part.
Survey design and analysis
Field and phone surveys with proper sampling, questionnaires and results by booth cluster and segment.
Swing and scenario models
Estimates of how shifts in turnout or vote share in certain booths could change the result.
Constituency profiles
Short, visual profiles of each assembly or parliamentary seat for leaders and candidates.
Where voter analysis makes a difference
Seat assessment
Profiles and survey findings that inform a party's assessment of seats.
Campaign planning
Prioritised booth lists for door-to-door work, events and outreach.
Mid-campaign tracking
Repeated surveys that show whether campaign effort is moving opinion.
Post-election review
A booth-level review of what worked and what did not, for the next cycle.
How we deliver voter analysis
- 1
Data collection
Form 20 results, electoral rolls and boundary details gathered and cleaned.
- 2
Mapping
Booths mapped to wards, villages and assembly segments.
- 3
Analysis
Classification, trends and swing models built and checked with the local team.
- 4
Field validation
Findings tested against ground reports and survey data.
- 5
Briefing
Clear recommendations shared with leaders and updated through the campaign.
Standards and compliance
What every voter analysis engagement with P Intelligence follows.
- Analysis uses publicly available results and electoral rolls, along with survey data collected with consent.
- We do not create appeals on religion, race, caste, community or language, which the Representation of the People Act, 1951 treats as a corrupt practice.
- Survey respondents' personal details are protected and kept separate from published findings.
- Each client's analysis is confidential and never shared with other parties or candidates.
Frequently asked questions about voter analysis
What is booth-level voter analysis?
It is the study of how each polling booth in a constituency has voted and how its voters have changed. It combines past results, electoral rolls and survey data to show where a campaign should focus.
What is Form 20?
Form 20 is the final result sheet that records the votes polled by each candidate at every polling station in a constituency. It is the most detailed public source of past booth-level results.
How accurate are surveys?
Accuracy depends on sample size, method and timing. We state the margin of error for every survey and recommend repeating key questions during the campaign to track change, rather than relying on a single reading.
Can you analyse a constituency after delimitation?
Yes. We map old booths to new boundaries where possible and clearly mark where comparisons are estimates.
How quickly can you deliver a constituency study?
A first study for a single constituency can usually be prepared within a few weeks, depending on data availability. State-wide studies are delivered in phases.
Often combined with Voter Analysis
Election Software Development
Booth and karyakarta management apps, war-room dashboards, polling-day reporting and candidate office systems, built for the scale and pace of an election.
Explore Election Software Development Media & Narrative IntelligenceSentiment Analysis
Positive, negative and neutral readings by topic, region and language, including Hindi and Gujarati content.
Explore Sentiment Analysis Citizen & Voter OutreachAI Calling
Natural voice calls for surveys, event invitations, scheme awareness and feedback, with every answer logged to your dashboard.
Explore AI Calling
Planning voter analysis?
Tell us about your department, office or campaign. A practice lead from our New Delhi or Ahmedabad team will reply with next steps.